library(tidyverse)
library(scales)
library(gapminder)

gapminder_2007 <- gapminder |>
  filter(year == 2007)

ggplot(gapminder_2007, aes(x = gdpPercap)) +
  geom_histogram(binwidth = 1000) +
  scale_x_continuous(labels = label_comma())
In exercise 10, you were supposed to include your enhanced plot in the Quarto document with your reflection, but it was a little tricky to do.
Adding images to your document doesn’t actually involve R—it’s a Markdown thing, just like how you use *italics* or ## headings. The guide to using Markdown has an example of the syntax:
Again, that’s not R code—don’t put it in a chunk. If you do, things will break.
↓ THIS IS WRONG ↓
```{r}

```Instead, make sure you put the image syntax outside of a chunk with your regular text:
Blah blah I'm writing text here.
Here's some code I wrote:
```{r}
library(tidyverse)
ggplot(...) +
geom_whatever()
```
Blah blah I'm writing more text again. Here's a neat picture I made:
Quarto lets you do fancier things with images too, like controlling their widths, making them centered or left or right aligned, and laying out multiple figures all at once. See the documentation for full details and examples:
{width=60% fig-align="right"}There are no exact rules for this! It depends on how much work you want to do where. With {ggtext} and other R packages, you can do a lot of adjustment in R itself without even needing Illustrator.
Some people like adding labels in R; some people like doing it in Illustrator. Some people like modifying colors in R; some people like doing it in Illustrator. If it’s easier to add notes and change colors, etc. with annotate(), then cool—use R. If you’re adding a lot more detail and it would be trickier to do it with R, or if you just don’t want to deal with a ton of annotate() laters, then cool—use Illustrator.
I personally try to do as much as possible in R before putting anything in Illustrator, not because it’s necessarily trickier to do things in Illustrator, but to save time—if I want to make a second similar plot, copying/pasting/adapting the code from the first plot is a lot faster than remembering all the little tweaks I made in Illustrator.
Basically the only guideline is “do things wherever they’re easiest.”
Yes you can! There’s an incredible package called {scales}. It lets you format numbers and axes and all sorts of things in magical ways. If you look at the documentation, you’ll see a ton of label_SOMETHING() functions, like label_comma(), label_dollar(), and label_percent().
You can use these different labeling functions inside scale_AESTHETIC_WHATEVER() layers in ggplot.
label_comma() adds commas:
library(tidyverse)
library(scales)
library(gapminder)
gapminder_2007 <- gapminder |>
filter(year == 2007)
ggplot(gapminder_2007, aes(x = gdpPercap)) +
geom_histogram(binwidth = 1000) +
scale_x_continuous(labels = label_comma())
label_dollar() adds commas and includes a “$” prefix:
ggplot(gapminder_2007, aes(x = gdpPercap)) +
  geom_histogram(binwidth = 1000) +
  scale_x_continuous(labels = label_dollar())
label_percent() multiplies values by 100 and formats them as percents:
gapminder_percents <- gapminder_2007 |>
  group_by(continent) |>
  summarize(n = n()) |>
  mutate(prop = n / sum(n))

ggplot(gapminder_percents, aes(x = continent, y = prop)) +
  geom_col() +
  scale_y_continuous(labels = label_percent())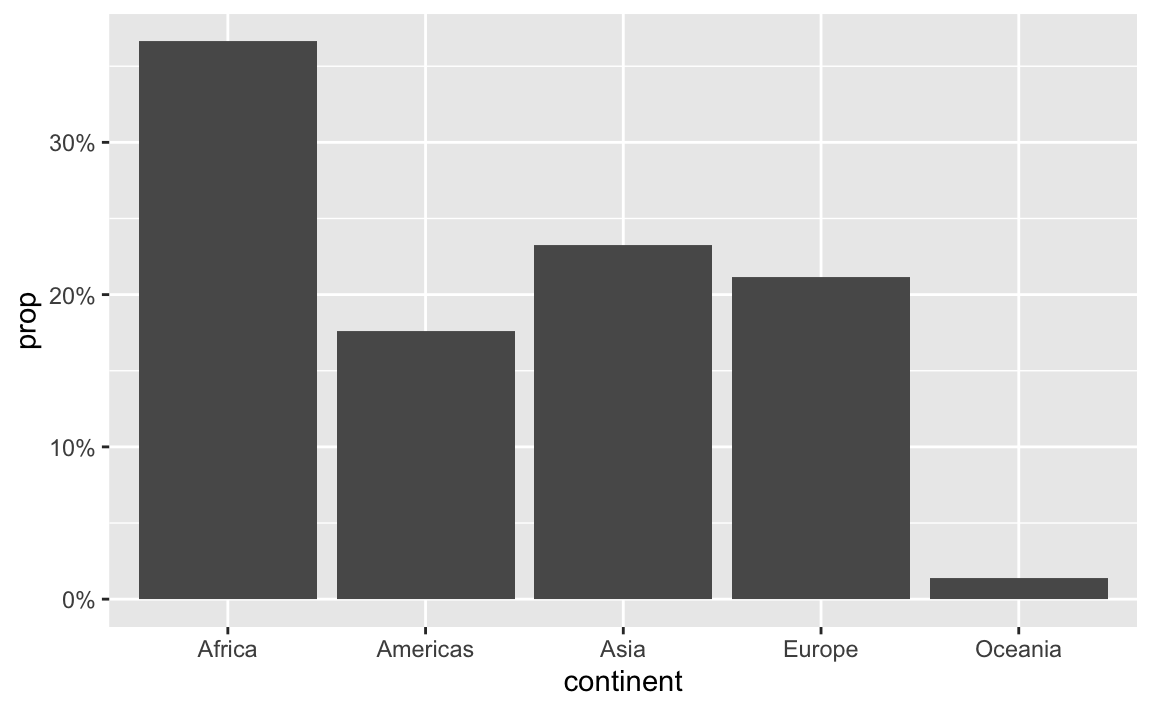
You can also change a ton of the settings for these different labeling functions. Want to format something as Euros and use periods as the number separators instead of commas, like Europeans? Change the appropriate arguments! You can check the documentation for each of the label_WHATEVER() functions to see what you can adjust (like label_dollar() here)
ggplot(gapminder_2007, aes(x = gdpPercap)) +
  geom_histogram(binwidth = 1000) +
  scale_x_continuous(labels = label_dollar(prefix = "€", big.mark = "."))
All the label_WHATEVER() functions actually create copies of themselves, so if you’re using lots of custom settings, you can create your own label function, like label_euro() here:
# Make a custom labeling function
label_euro <- label_dollar(prefix = "€", big.mark = ".")

# Use it on the x-axis
ggplot(gapminder_2007, aes(x = gdpPercap)) +
  geom_histogram(binwidth = 1000) +
  scale_x_continuous(labels = label_euro)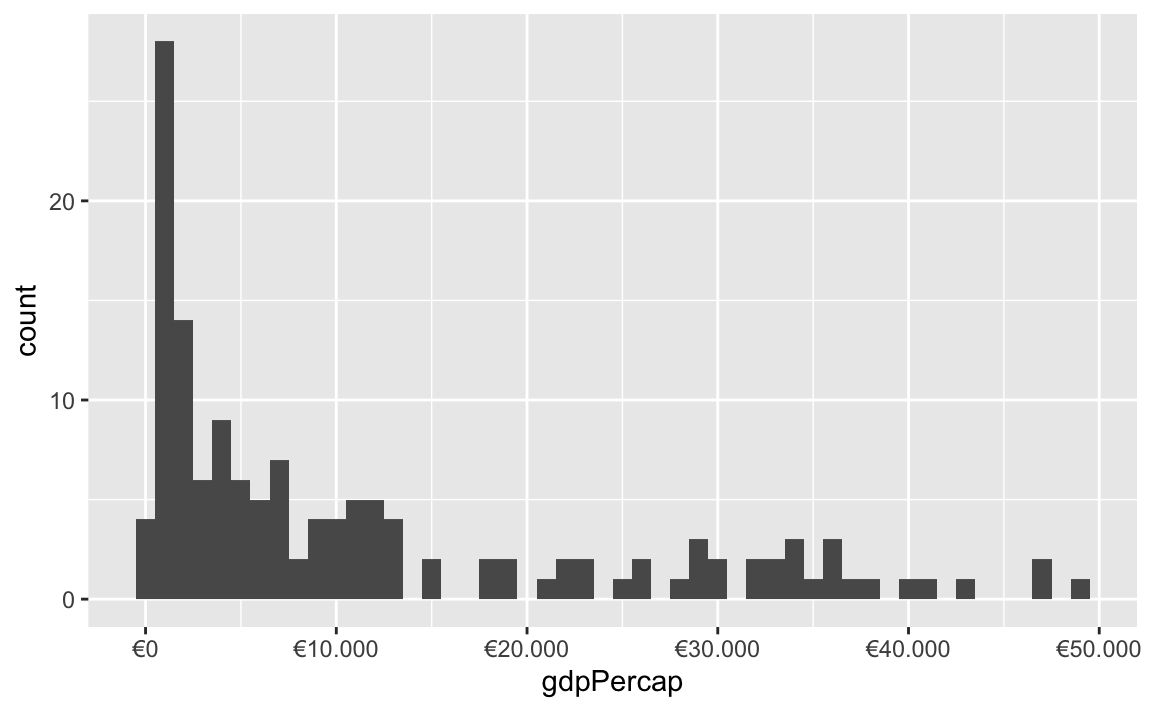
These labeling functions also work with other aesthetics, like fill and color and size. Use them in scale_AESTHETIC_WHATEVER():
ggplot(
  gapminder_2007,
  aes(x = gdpPercap, y = lifeExp, size = pop, color = pop)
) +
  geom_point() +
  scale_x_continuous(labels = label_dollar()) +
  scale_size_continuous(labels = label_comma()) +
  scale_color_viridis_c(labels = label_comma())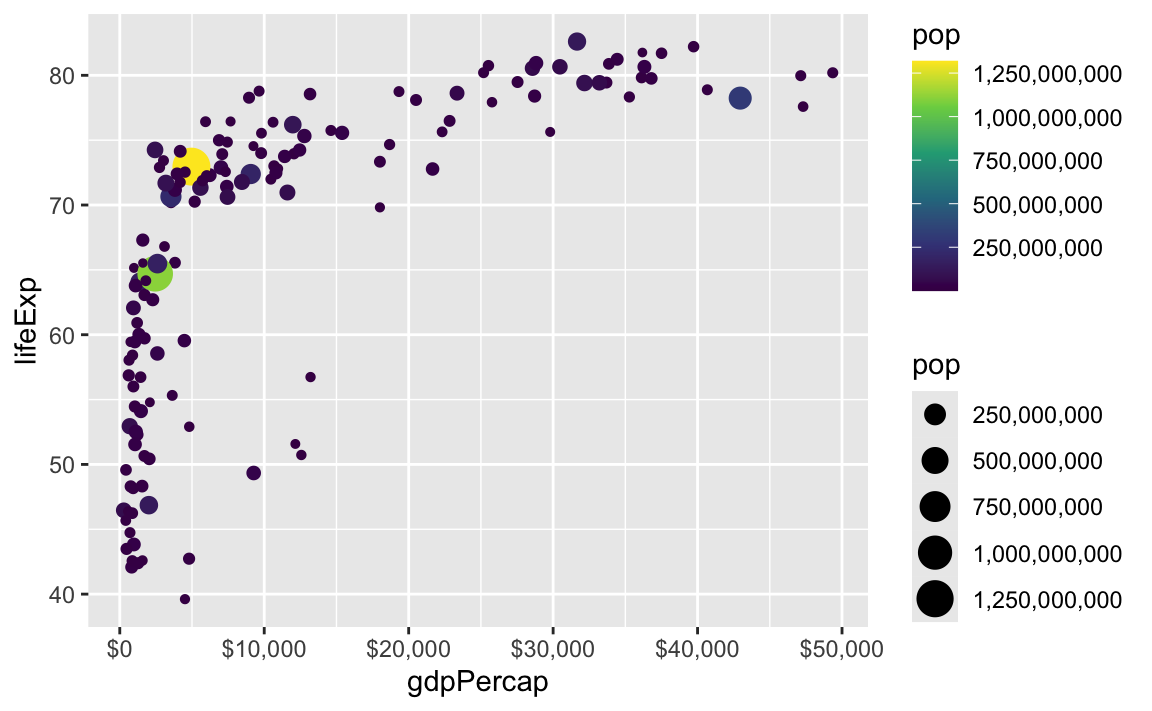
There are also some really neat and fancy things you can do with scales, like formatting logged values, abbreviating long numbers, and many other things. Check out this post for an example of working with logged values.
ggplot(
  gapminder_2007,
  aes(x = gdpPercap, y = lifeExp, size = pop, color = continent)
) +
  geom_point() +
  scale_x_log10(
    breaks = 500 * 2^seq(1, 9, by = 1),
    labels = label_dollar(scale_cut = append(scales::cut_short_scale(), 1, 1))
  ) +
  scale_size_continuous(labels = label_comma(scale_cut = cut_short_scale()))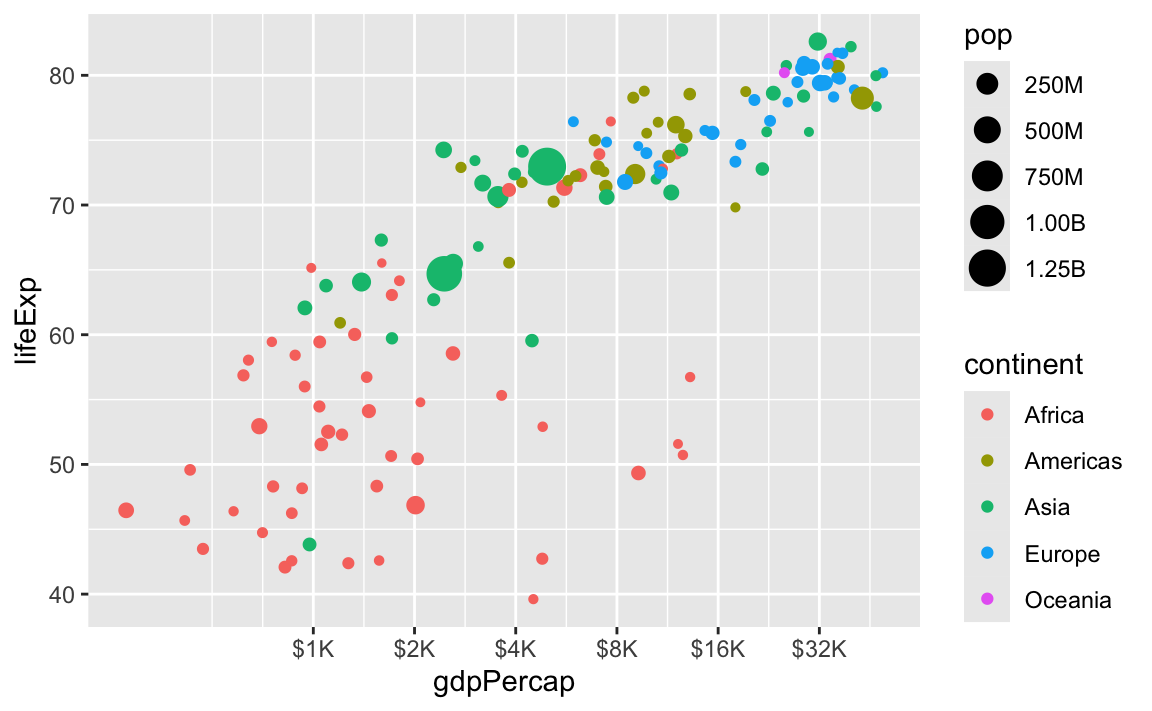
In Mini Project 1 (and in other exercises that involve dates), lots of you wanted to take month numbers and change them into month names or month abbreviations.
Some of you used something like a big if else statement: if the month number is 1, use “January”; if the month number is 2, use “February”; and so on
... |>
  mutate(month_name = case_when(
    month_number == 1 ~ "January",
    month_number == 2 ~ "February",
    month_number == 3 ~ "March",
    ...
  ))
While that works, it’s kind of a brute force approach. There are better, far easier ways.
In the FAQs for sessions 7 and 8, I showed how R has built-in variables for US state and region names:
state.name
##  [1] "Alabama"        "Alaska"         "Arizona"        "Arkansas"       "California"     "Colorado"
##  [7] "Connecticut"    "Delaware"       "Florida"        "Georgia"        "Hawaii"         "Idaho"
## [13] "Illinois"       "Indiana"        "Iowa"           "Kansas"         "Kentucky"       "Louisiana"
## [19] "Maine"          "Maryland"       "Massachusetts"  "Michigan"       "Minnesota"      "Mississippi"
## [25] "Missouri"       "Montana"        "Nebraska"       "Nevada"         "New Hampshire"  "New Jersey"
## [31] "New Mexico"     "New York"       "North Carolina" "North Dakota"   "Ohio"           "Oklahoma"
## [37] "Oregon"         "Pennsylvania"   "Rhode Island"   "South Carolina" "South Dakota"   "Tennessee"
## [43] "Texas"          "Utah"           "Vermont"        "Virginia"       "Washington"     "West Virginia"
## [49] "Wisconsin"      "Wyoming"
state.region
##  [1] South         West          West          South         West          West          Northeast     South
##  [9] South         South         West          West          North Central North Central North Central North Central
## [17] South         South         Northeast     South         Northeast     North Central North Central South
## [25] North Central West          North Central West          Northeast     Northeast     West          Northeast
## [33] South         North Central North Central South         West          Northeast     Northeast     South
## [41] North Central South         South         West          Northeast     South         West          South
## [49] North Central West
## Levels: Northeast South North Central West
I then showed how to join those into other datasets as new columns.
You can do something similar with month.name and month.abb, which are also special built-in variables:
month.name
##  [1] "January"   "February"  "March"     "April"     "May"       "June"      "July"      "August"    "September"
## [10] "October"   "November"  "December"
month.abb
##  [1] "Jan" "Feb" "Mar" "Apr" "May" "Jun" "Jul" "Aug" "Sep" "Oct" "Nov" "Dec"
But that’s still kinda miserable to work with, and there’s no built-in data for weekday names. Also, if you merge month names like this, they will appear in your plots in alphabetic order instead of January → February → March, and you’ll have to do extra work to get them in the right order.
There’s a better, far easier way!
The {lubridate} package (one of the nine packages that gets loaded when you run library(tidyverse)) has some neat functions for extracting and formatting parts of dates. You saw a bunch of these in the starter code for Mini Project 1, like year() and month() and wday():
rats_clean <- rats_raw |>
  ... |>
  mutate(sighting_year = year(created_date),
         sighting_month = month(created_date),
         sighting_day = day(created_date),
         sighting_weekday = wday(created_date, label = TRUE, abbr = FALSE))
These take dates and do stuff with them. For instance, let’s put today’s date in a variable named x:
x <- ymd("2025-07-15")
x
## [1] "2025-07-15"
We can extract the year using year():
year(x)
## [1] 2025
…or the week number using weeknum():
week(x)
## [1] 28
…or the month number using month():
month(x)
## [1] 7
If you look at the help page for month(), you’ll see that it has arguments for label and abbr, which will toggle text instead numbers, and full month names instead of abbreviations:
month(x, label = TRUE, abbr = TRUE)
## [1] Jul
## Levels: Jan < Feb < Mar < Apr < May < Jun < Jul < Aug < Sep < Oct < Nov < Dec
month(x, label = TRUE, abbr = FALSE)
## [1] July
## 12 Levels: January < February < March < April < May < June < July < August < September < October < ... < December
It outputs ordred factors too, so the months are automatically in the right order for plotting!
wday() does the same thing for days of the week:
wday(x)
## [1] 3
wday(x, label = TRUE, abbr = TRUE)
## [1] Tue
## Levels: Sun < Mon < Tue < Wed < Thu < Fri < Sat
wday(x, label = TRUE, abbr = FALSE)
## [1] Tuesday
## Levels: Sunday < Monday < Tuesday < Wednesday < Thursday < Friday < Saturday
So instead of doing weird data contortions to get month names or weekday names, just use month() and wday(). You can use them directly in mutate(). For example, here they are in action in a little sample dataset:
example_data <- tribble(
  ~event, ~date,
  "Moon landing", "1969-07-20",
  "WHO COVID start date", "2020-03-13"
) |>
  mutate(
    # Convert to an actual date
    date_actual = ymd(date),
    # Extract a bunch of things
    year = year(date_actual),
    month_num = month(date_actual),
    month_abb = month(date_actual, label = TRUE, abbr = TRUE),
    month_full = month(date_actual, label = TRUE, abbr = FALSE),
    week_num = week(date_actual),
    wday_num = wday(date_actual),
    wday_abb = wday(date_actual, label = TRUE, abbr = TRUE),
    wday_full = wday(date_actual, label = TRUE, abbr = FALSE)
  )
example_data
## # A tibble: 2 × 11
##   event                date       date_actual  year month_num month_abb month_full week_num wday_num wday_abb wday_full
##   <chr>                <chr>      <date>      <dbl>     <dbl> <ord>     <ord>         <dbl>    <dbl> <ord>    <ord>
## 1 Moon landing         1969-07-20 1969-07-20   1969         7 Jul       July             29        1 Sun      Sunday
## 2 WHO COVID start date 2020-03-13 2020-03-13 2020 3 Mar March 11 6 Fri FridayLots of you speak languages other than English. While R functions like plot() and geom_point() and so on are locked into English, the messages and warnings that R spits out can be localized into most other languages. R detects what language your computer is set to use and then tries to match it.
Functions like month() and wday() also respect your computer’s language setting and will give you months and days in whatever your computer is set to. That’s neat, but what if your computer is set to French and you want the days to be in English? Or what if your computer is set to English but you’re making a plot in German?
You can actually change R’s localization settings to get output in different languages!
If you want to see what your computer is currently set to use, run Sys.getLocale():
Sys.getlocale()
## [1] "en_US.UTF-8/en_US.UTF-8/en_US.UTF-8/C/en_US.UTF-8/en_US.UTF-8"
There’s a bunch of output there—the first part (en_US.UTF-8) is the most important and tells you the language code. The code here follows a pattern and has three parts:
en. This is the langauge, and typically uses a two-character abbreviation following the ISO 639 standardUS. This is the country or region for that language, used mainly to specify the currency. If it’s set to en_US, it’ll use US conventions (like “$” and “color”); if it’s set to en_GB it’ll use British conventions (like “£” and “colour”). It uses a two-character abbreviation following the ISO 3166 standard.UTF-8. This is how the text is actually represented and stored on the computer. This defaults to Unicode (UTF-8) here. You don’t generally need to worry about this.For macOS and Linux (i.e. Posit Cloud), setting locale details is pretty straightforward and predictable because they both follow this pattern consistently:
en_GB: British Englishfr_FR: French in Francefr_CH: French in Switzerlandde_CH: German in Switzerlandde_DE: German in GermanyIf you run locale -a in your terminal (not in your R console) on macOS or in Posit Cloud, you’ll get a list of all the different locales your computer can use. Here’s what I have on my computer:
 [1] "af_ZA" "am_ET" "ar_AE" "ar_EG" "ar_JO" "ar_MA" "ar_QA" "ar_SA" "be_BY" "bg_BG" "C"     "ca_AD" "ca_ES" "ca_FR"
[15] "ca_IT" "cs_CZ" "da_DK" "de_AT" "de_CH" "de_DE" "el_GR" "en_AU" "en_CA" "en_GB" "en_HK" "en_IE" "en_IN" "en_NZ"
[29] "en_PH" "en_SG" "en_US" "en_ZA" "es_AR" "es_CR" "es_ES" "es_MX" "et_EE" "eu_ES" "fa_AF" "fa_IR" "fi_FI" "fr_BE"
[43] "fr_CA" "fr_CH" "fr_FR" "ga_IE" "he_IL" "hi_IN" "hr_HR" "hu_HU" "hy_AM" "is_IS" "it_CH" "it_IT" "ja_JP" "kk_KZ"
[57] "ko_KR" "lt_LT" "lv_LV" "mn_MN" "nb_NO" "nl_BE" "nl_NL" "nn_NO" "no_NO" "pl_PL" "POSIX" "pt_BR" "pt_PT" "ro_RO"
[71] "ru_RU" "se_FI" "se_NO" "sk_SK" "sl_SI" "sr_RS" "sr_YU" "sv_FI" "sv_SE" "tr_TR" "uk_UA" "zh_CN" "zh_HK" "zh_TW"
For whatever reason, Windows doesn’t use this naming convention. It uses dashes or full words instead, like en-US or american or en-CA or canadian. You can see a list here, or google Windows language country strings (that’s actually RStudio’s official recommendation for finding Windows language codes)
Once you know the language code, you can use it in R. Let’s make a little variable named x with today’s date:
x <- ymd("2024-07-12")Because I’m using English as my default locale, the output of wday() and month() will be in English:
wday(x, label = TRUE, abbr = FALSE)
## [1] Friday
## Levels: Sunday < Monday < Tuesday < Wednesday < Thursday < Friday < Saturday
month(x, label = TRUE, abbr = FALSE)
## [1] July
## 12 Levels: January < February < March < April < May < June < July < August < September < October < ... < December
Those functions have a locale argument, though, so it’s really easy to switch between languages:
wday(x, label = TRUE, abbr = FALSE, locale = "en_US")
## [1] Friday
## Levels: Sunday < Monday < Tuesday < Wednesday < Thursday < Friday < Saturday
wday(x, label = TRUE, abbr = FALSE, locale = "fr_FR")
## [1] Vendredi
## Levels: Dimanche < Lundi < Mardi < Mercredi < Jeudi < Vendredi < Samedi
wday(x, label = TRUE, abbr = FALSE, locale = "fr_BE")
## [1] vendredi
## Levels: dimanche < lundi < mardi < mercredi < jeudi < vendredi < samedi
wday(x, label = TRUE, abbr = FALSE, locale = "it_IT")
## [1] Venerdì
## Levels: Domenica < Lunedì < Martedì < Mercoledì < Giovedì < Venerdì < Sabato
wday(x, label = TRUE, abbr = FALSE, locale = "zh_CN")
## [1] 星期五
## Levels: 星期日 < 星期一 < 星期二 < 星期三 < 星期四 < 星期五 < 星期六month(x, label = TRUE, abbr = FALSE, locale = "en_US")
## [1] July
## 12 Levels: January < February < March < April < May < June < July < August < September < October < ... < December
month(x, label = TRUE, abbr = FALSE, locale = "fr_FR")
## [1] juillet
## 12 Levels: janvier < février < mars < avril < mai < juin < juillet < août < septembre < octobre < ... < décembre
month(x, label = TRUE, abbr = FALSE, locale = "fr_BE")
## [1] juillet
## 12 Levels: janvier < février < mars < avril < mai < juin < juillet < août < septembre < octobre < ... < décembre
month(x, label = TRUE, abbr = FALSE, locale = "it_IT")
## [1] Luglio
## 12 Levels: Gennaio < Febbraio < Marzo < Aprile < Maggio < Giugno < Luglio < Agosto < Settembre < ... < Dicembre
month(x, label = TRUE, abbr = FALSE, locale = "zh_CN")
## [1] 七月
## Levels: 一月 < 二月 < 三月 < 四月 < 五月 < 六月 < 七月 < 八月 < 九月 < 十月 < 十一月 < 十二月You can also set the locale for your entire R session like this:
Sys.setlocale(locale = "de_DE")
## [1] "de_DE/de_DE/de_DE/C/de_DE/en_US.UTF-8"
Now month() and wday() will use German by default without needing to set the locale argument:
month(x, label = TRUE, abbr = FALSE)
## [1] Juli
## 12 Levels: Januar < Februar < März < April < Mai < Juni < Juli < August < September < Oktober < ... < Dezember
wday(x, label = TRUE, abbr = FALSE)
## [1] Freitag
## Levels: Sonntag < Montag < Dienstag < Mittwoch < Donnerstag < Freitag < Samstag
I’ll switch everything back to English for the rest of this post :)
Sys.setlocale(locale = "en_US.UTF-8")
## [1] "en_US.UTF-8/en_US.UTF-8/en_US.UTF-8/C/en_US.UTF-8/en_US.UTF-8"